

Written by: Edward Harrison
These days it feels like everyone is just waiting for the economy to buckle under the weight of supersized interest rate hikes. The funny thing with recession is that we won’t officially know whether we’re in one until months after it has set in. So how do we gauge when a recession begins and how do we prepare for one? I have some thoughts.
Recession talk is everywhere
The global economy is slowing. Talk about a recession is sopalpable, almost as if we’re in one already. In financial markets, everyone iswaiting for the next shoe to drop, as the interest rates are rising at an unprecedented pace and the Federal Reserve is committed to combat inflation at all costs.
The reality, though, is we’re not in a recession in the US right now. The economic data show a slowing, but still growing, economy through May. You might think the cautious optimism of Fed Chair Jerome Powell on how this episode ends is misplaced. But there is still a chance that the Fed threads the needle.
Unfortunately, that chance did diminish significantly last week as a slew of central banks ramped up the pace of monetary tightening. What this means is that the chance of a recession globally has not just increased, it has been moved forward. The US economy won’t be left unscathed.
Here’s the problem. The committee that officially dates recessions doesn’t do so until months after we’re already in one. That doesn’t help anyone trying to prepare their household or their business financially. So how do we gauge when a recession begins? Why does it even matter? And how do we prepare for one? I have three gauges — two are market-based signals and the other focuses on the real economy. The latter is the most important — and it could foretell recession as soon as November.
This is a big tightening cycle
I want to go back to my comments about the accelerated pace of monetary tightening to combat inflation. The level of oncoming tighteningfrom the Fed aloneis unprecedented in recent history. We have to go back decades to the late 1980s when the Fed raised rates by more than three percentage points in a little over a year. And that episode ended with a US recession.
This time the tightening action is global. On Thursday alone we witnessed a fifth rate hike from the Bank of England in the UK, with the three dissents opening the way for a half-percentage point increase in the future. The Swiss National Bank did exactly that, with a surprise half-percentage point move. Earlier in the week, the ECB held an emergency meeting around so-called “anti-fragmentation” policy that cleared the path for jumbo rate hikes in the euro area by ensuring government bond spreads won’t blow out as a result. Rates aren’t just going higher, they’re going higher fast.
There are a ton of questions now. But I think the most important one is this: what difference does it make if we’re in a growth recession or an actual recession? For one, it could determine how far the market correction goes.
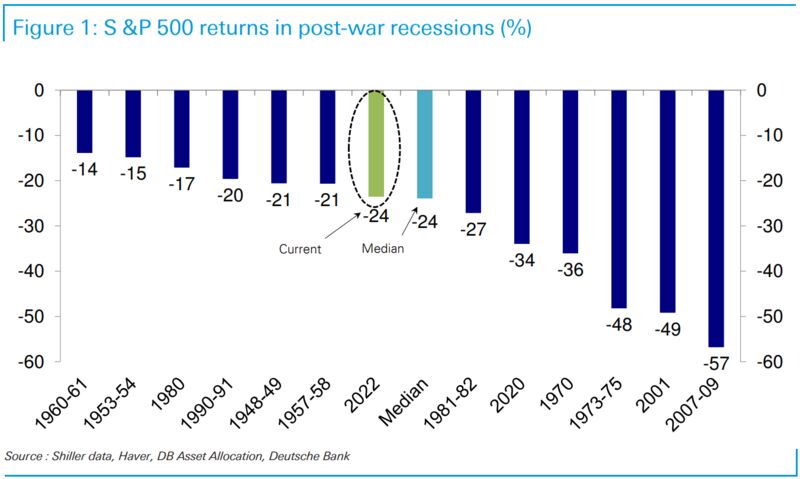
Jim Reid, the head of Thematic Research over at Deutsche Bank laid out the answer pretty nicely in a note to investors after the selloff on Thursday last week.
With the -3.25% sell-off overnight, the S&P 500’s correction moved in line with the median correction seen in post-WWII recessions. In fact, it’s now the fourth worst non-recession correction over the same period.
Basically, there aren’t many instances of equity declines worse than this that don’t presage recession. If we’re in a growth recession, things are about as bad as they’re going to get from a markets perspective. Reid says:
Clearly if you think we can avoid a recession completely then the three biggest post-WWII non-recession corrections are the -26.6% (May 1946-), -28% (Dec 1961-) and -33.5% (Aug 1987-). The last of these included the 1987 stock market crash. So, if we don’t get a recession, we are getting close to extreme territory.
If the economy is headed for recession though, things can get a lot worse from here.
And since I’ve been telling you we’re not in a garden variety slowdown but instead in aprofit and margin mean reversion, I would argue the losses we’ve seen thus far are mostly attributable to those causes. So the equity market isn’t predicting recession yet — thoughsome might disagree.
But what’s more. UBS strategist Matt Mish says US credit spreads are only pricing in a 25% probability of recession. And since debt is higher in a company’s capital structure pecking order, credit markets are generally believed to be more sensitive to recessions than equities. Thus, were this slowing and margin squeeze to turn into something greater, we should see greater losses from here.
That’s the big difference between a mid-cycle slowdown and an actual recession.
- 12,000Year's increase in average initial claims when recession began in Dec. 2007
What the data say
You can see the slowing in the US economic data already.
For example, on the corporate side of things, the Atlanta Fed’s GDPNow model -- which is like a road-race pace clock for the US economy because it measures where we’d finish based on the pace thus far -- sees real residential investment contracting 7.7% for 2Q 2022 based on data through June 16. With the average 30-year fixed mortgage rate now near 6%, the highest level since 2008, home builders are reining in construction despite a lack of supply.Housing starts droppedto a 1.549 million annual pace from a recent cycle high over 1.8 million.
The consumer is also starting to show signs of weakness. Retail sales in Maywere down, though mostly because of auto sales, which jump around a lot from month to month. And it was the first time in five months. If you strip out autos, retail sales were still growing, but marginally less than the prior month. The real problem is that much of the increase was due to the higher cost of gasoline. Take away autos and gas, and retail sales in the US were rising a paltry 0.1% -- suggesting inflation is now high enough to destroy demand for some discretionary spending.
Overall, the data paint a picture of an economy that’s slowing, though not in a recession. But when you add to that the accelerated pace of monetary tightening globally, the potential of a full-scale downturn grows.
My canaries in the coalmine
If you want to get ahead of a recession, you need to know whether one is likely. In terms of market data, my so-called “barometer of truth” is the spread between two- and five-year Treasury yields. That’s because the two-year captures all of the near-term Fed hiking and the five-year captures what happens to policy in the period thereafter. If the Fed is forced to start cutting rates aggressively because of a recession, this spread should be negative. And it has been before the last three recessions.
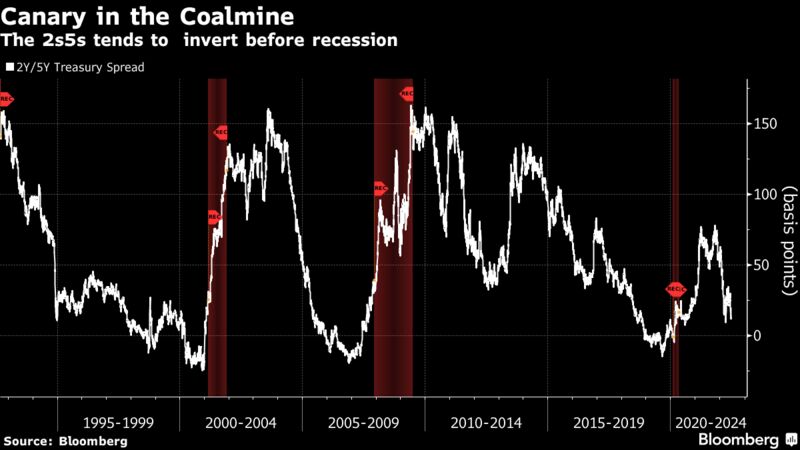
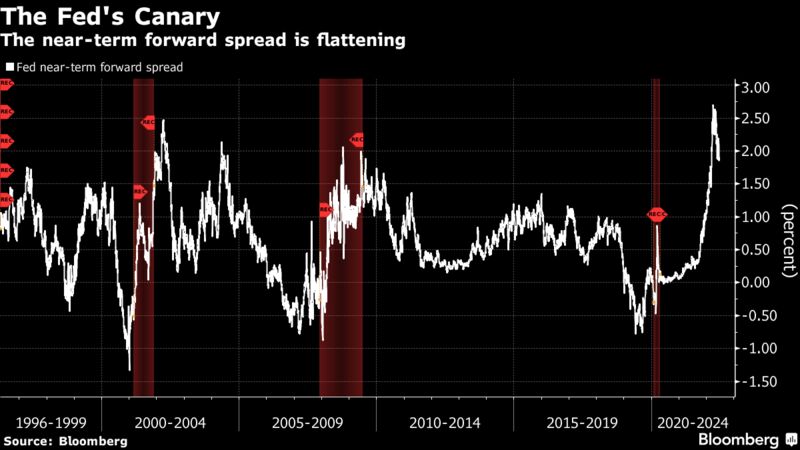
Right now, the five-year yield is around 20 basis points above the two-year yield. The Fed likes a different measure, one called the near-term forward spread. That measures the 3-month Treasury versus what the marketexpectsthe 3-month to be in 18 months. This should fully capture market expectations for tightening such that if it becomes negative, the market is telling you things are so bad in the economy that the Fed will be cutting rates soon.
While this curve has flattened almost a full percentage point in the last two months, we’re far from it being negative. That gives the Fed room to raise rates almost two percentage points before it starts to worry about a recession.
But I like real economy data points, especially when they are real-time measures. They tell you what’s happening in the here and now.
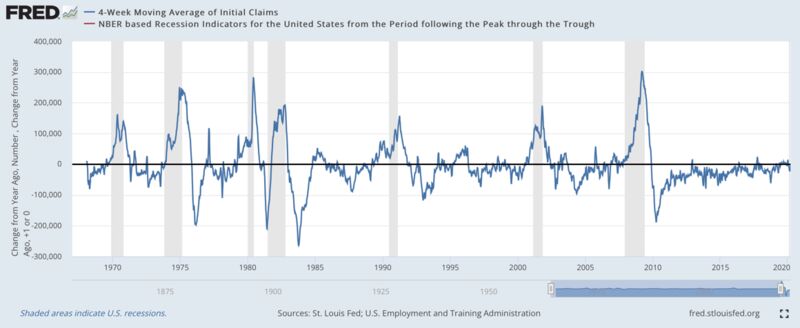
Take claims for unemployment insurance. Often times when one loses their job, some of the income loss can be mitigated by unemployment insurance. And in a big economy like the US, there’s always going to be some churn. So there will always be some initial jobless claims every week.
The weekly initial jobless claims figure captures in real time how much more stressed the labor market has become and how much income has been lost to support consumption. Ever since the data series began in 1967, the year-on-year increase in (4-week) average initial jobless claims has never reached 50,000 and stayed at that elevated level for more than a week or two without a recession. And it has only breached the year-on-year +50,000 hurdle once very briefly in 1977 without a recession.
How close to recession are we?
April, May and June have seen a massive surge in initial jobless claims — so much so I am worried.
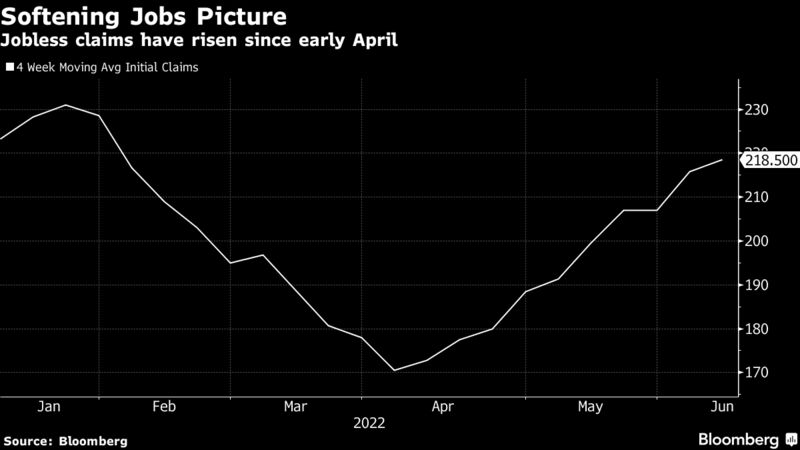
However, while average claims have risen by 48,000 since the week ended April 2nd, year-on-year comparisons are still really favorable because of the pandemic. That means the job, income and consumption loss isn’t enough to have triggered a recession...yet.
By November, these comparisonscould become unfavorable. That’s because the average had dropped to 244,250 by the end of November 2021. In effect, weekly initial jobless claims only have to rise marginally -- less than 30,000 -- from here for year-on-year comparisons to look worrisome. And that would be your early warning sign of recession.
----------------------------------------------------------
----------------------------------------------------------
Important Disclosures:
Content in this material is for general information only and not intended to provide specific advice or recommendations for any individual. All performance referenced is historical and is no guarantee of future results. All indices are unmanaged and may not be invested into directly. The economic forecasts set forth in this material may not develop as predicted and there can be no guarantee that strategies promoted will be successful.
Tracking Number: 1-05296835